Imagine this scenario: Three weeks ago, your ad account was firing on all cylinders. Your cost per acquisition (CPA) was stable, your Return on Ad Spend (ROAS) was climbing, and you confidently dialed up your daily budgets.
Then, almost overnight, the floor fell out.
CPCs spiked. Click-through rates plunged. Conversion rates hit a wall.
Your media buying team immediately scrambles to tweak custom audiences, change bidding strategies, or adjust lookalikes. What if it was your creative that’s broken, not your media buying?
In 2026, algorithmic ad networks like Meta and TikTok have completely automated targeting. Media buying has been commoditized. Today, ad creative is your targeting, your positioning, and your primary lever for growth. Yet, for most direct-to-consumer (DTC) brands, creative production remains the ultimate friction point. This is the e-commerce ad creative bottleneck, and if you try to solve it by simply telling your graphic designers to “make more ads,” you are going to destroy your margins.
Here is the exact framework to move past the creative treadmill and build a scalable production engine that drives real revenue:
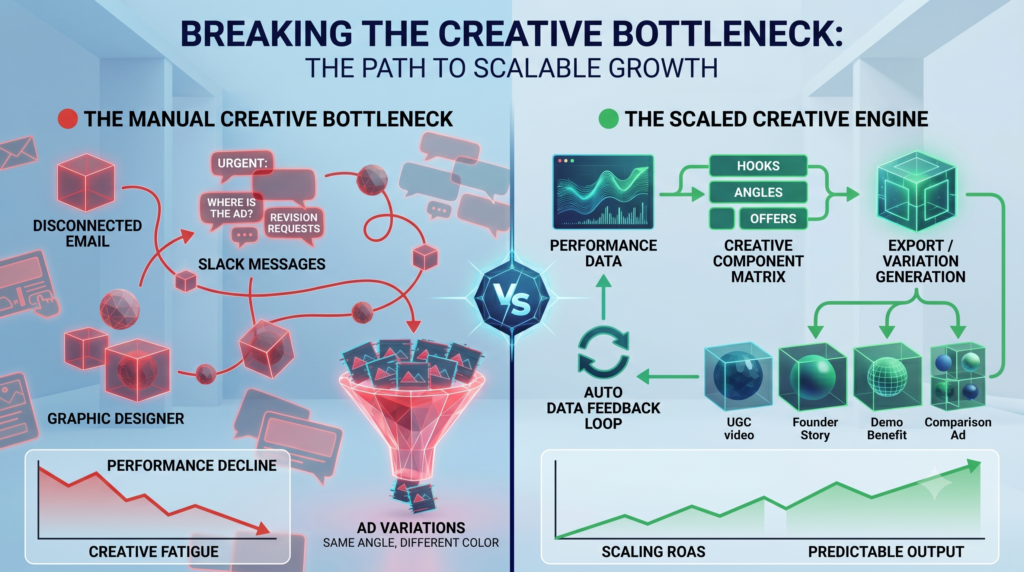
1. Creative Fatigue Is an Infrastructure Problem, Not a Headcount Problem
When performance dips, the default response for most growth teams is to demand more volume.
But throwing raw volume at a strategic issue creates what we call the Death Spiral of Creative Fatigue:
- An ad concept fatigues in 7 to 14 days.
- CPA doubles.
- You pause the campaign, losing algorithmic learning.
- You rush to launch minor variations (e.g., changing a headline font or a button color).
- Meta’s algorithm recognizes the visual assets as functionally identical, jacks up your CPMs, and the cycle repeats.
As noted by industry benchmarks, Meta’s internal data reveals that 56% of all auction campaign outcomes are driven solely by creative quality. The brands scaling past $10M and $50M annual revenues understand that “creative quality” doesn’t mean expensive, cinematic studio shoots. It means strategic variation—putting fundamentally different psychological arguments, formats, and hooks in front of your customer cohorts.
💡 THE STRATEGIC VARIATION PRINCIPLE:
Five minor variations of the exact same headline on the same product shot perform as ONE creative to the algorithm. Conversely, a raw UGC video, a founder’s story, a feature-benefit comparison, and a 2-second pattern-interrupt unboxing function as FOUR separate assets, opening up entirely new audience segments.
To achieve this without burning out your team, you don’t need more headcount; you need a fundamental shift in your ad creative infrastructure.
2. The 3 Golden Pillars of Creative Scalability
To permanently break the creative bottleneck, your brand must build a system where the marginal cost of an additional variation collapses while throughput scales. This requires three distinct pillars:
Pillar A: Define Your Modular Creative Components
Stop treating every ad brief like a blank canvas. Treat your creative assets like software code built from modular blocks. Formalize your building blocks into a standardized asset matrix:
- The First 3 Seconds (The Hook): Test 5 distinct visual “pattern interrupts” (e.g., text bubbles, raw product application, satisfying textures).
- The Body (The Angle): Is it an objection-handler, a social proof sequence, or an educational demo?
- The Offer/CTA: Test free shipping vs. bundles vs. limited-time discounts.
By mixing and matching 5 hooks, 3 bodies, and 2 CTAs, your editors can export 30 unique assets in a single afternoon rather than building 30 ads from scratch.
Pillar B: Decentralize Sourcing to Prevent Creative Homogeneity
If all your ads come from a single internal designer, your creative output will naturally suffer from visual homogeneity. The high-growth accounts we manage at ROAS Media source creative from at least three distinct channels:
- Internal Creative Team: Best for high-impact branded assets, core product landing page design, and bottom-of-funnel conversion tools.
- Continuous Creator/UGC Pipeline: Essential for top-of-funnel prospecting. Authentic, low-production, creator-led native videos must make up 30-70% of your paid social ad spend.
- External Creative Platforms for Scale: External partners provide fresh visual perspectives and scale up output during peak seasons (Q4, product launches) without expanding your fixed overhead.
Pillar C: Measure “Upstream” Creative Metrics
If your creative team only looks at blended ROAS or CPA, they are flying blind. By the time a media buyer realizes an ad failed based on ROAS, thousands of dollars have been wasted. Instead, integrate creative metrics into your daily dashboards:
- Thumb-Stop Rate (Hook Rate): (3-Second Video Views / Impressions). Target: >35%. If this is low, your hook failed.
- Hold Rate (Hold-Through Rate): (15-Second Video Views / Impressions). Target: >15%. If this is low, your pacing or narrative body failed.
- Click-To-Purchase Rate: If this drops while your Hook Rate is high, your ad successfully captured attention but failed to align with your landing page offer.

3. Selection vs. Volume: The Algorithmic Reality
Thanks to the rapid adoption of AI video generation and graphic automation tools, creating thousands of assets is easier than ever. However, this has created a new, critical problem: the selection paradox.
Flooding your ad account with hundreds of unvalidated AI variations does not help you scale. In fact, it bloats your ad sets, fragments conversion data, and forces the ad network’s algorithm into an endless state of calibration.
“The winning brands in the modern paid media landscape aren’t the ones who figure out how to generate the absolute most volume. They are the ones with the analytical framework to choose what NOT to run.”
At ROAS Media, we leverage a data-driven Creative Demand Model. Instead of guessing how many ads to make, we look at your monthly spend tiers, historical creative degradation rates, and seasonal targets to determine the right starting point for each client.
| Monthly Ad Spend | Recommended Monthly Unique Concepts | Required Asset Variations (Hooks/Formats) |
|---|---|---|
| $10,000 – $30,000 | 3 – 5 Concepts | 15 – 20 Variations |
| $30,000 – $100,000 | 5 – 10 Concepts | 30 – 50 Variations |
| $100,000+ | 12+ Concepts | 60+ Variations |
Conclusion: Stop Tweaking Bids. Start Engineering Creative.
If your e-commerce store is stuck at a revenue plateau, stop searching for a magic hack within Meta Ads Manager or TikTok Campaign Manager. The algorithm cannot save an uninspired, fatigued creative.
To achieve sustainable, scalable growth, you must bridge the gap between media buying analytics and creative asset production. Turn your creative department from an isolated cost center into a predictable, high-velocity operational system.
Ready to find the structural friction points in your paid media acquisition? Let’s look under the hood of your ad accounts.
Frequently Asked Questions (FAQ)
Q1: How do I know if my ad account is suffering from creative fatigue?
Look for a simultaneous drop in Click-Through Rate (CTR) and a spike in Frequency over a rolling 7-day period, accompanied by an increasing Cost Per Acquisition (CPA). If your frequency is climbing fast but conversions are dropping, your current target audience is tired of looking at that asset.
Q2: Should I completely stop running polished, high-end studio brand videos?
No. While raw User Generated Content (UGC) generally outperforms studio creative at the top of the funnel (prospecting), polished, branded creative remains vital. Branded assets establish visual trust, maintain consistency, and perform exceptionally well at the middle and bottom of the funnel (retargeting) to validate purchase decisions.
Q3: What is a good benchmark for a video ad’s Hook Rate?
A healthy benchmark for a social media video ad’s Thumb-Stop (Hook) Rate is between 30% and 45%. If your hook rate falls below 25%, it means viewers are scrolling past your video immediately. You should replace the first 2 to 3 seconds with a stronger pattern-interrupt, even if the rest of the video remains exactly the same.